MUMI: Multisine for multiple input systems: a user-friendly excitation toolbox for physical systems
Goals
Scientists and engineers want accurate mathematical models of physical systems for understanding, design, and control. To obtain accurate models, persistently exciting rich signals are needed. The MUMI Matlab toolbox creates multisine signals to assess the underlying systems in a time efficient, user-friendly way. In order to avoid any spectral leakage, to reach full nonparametric characterization of the noise, and to be able to detect nonlinearities and time-variations, multisine signals can be used. By the use of the toolbox, inexperienced users can easily create state-of-the-art excitation signals to be used to perturbate almost any physical systems.Main features

Excitation signal
Fully customizable random phase multisines (pseudo-random noise) optimized for multiple inputs.

Compatibility
MUMI is a Matlab based toolbox tested with versions from 2011a till 2020b and it is compatible with SAMI and LPRM.

GUI + CLI
MUMI supports Graphical User Interface and Command Line Interface.
Introduction
This work presents a user-friendly signal generation Matlab toolbox for real-life (industrial) experiments of physical systems with multiple inputs. Many structures are inherently time-varying and nonlinear. This toolbox addresses the questions related to the user-friendly design of experiment. When the proposed signals are used, it is easily possible a) to decide, if the underlying system is linear or not, b) to decide if the linear framework is still accurate (safe) enough to be used, and c) to tell the inexperienced (non-expert) user how much can be gained using an advanced time-varying or nonlinear framework. For detailed information w.r.t. estimation techniques, see the MSSP article.In modern system identification special excitation signals are available to assess the underlying systems in a user-friendly, time efficient way. To avoid any spectrum leakage, to reach full nonparametric characterization of the noise, and to be able to detect nonlinearities and time-variations, an advanced excitation signal is needed. Many users prefer noise excitations, because they seem simple to implement – and randomness is usually needed to fulfill silent assumptions on estimation framework applied in the work – but in this case the nonlinearities and time-variations are not identifiable, and there is a possible leakage error. One of the (best) possibilities is the usage of special multisines because they can avoid spectral leakage, inconsistency, non-persistency, and they provide a handy, robust solution to build linear models and to detect the level and type of nonlinearities and time-variations.
Most structures can be excited by the so-called random phase multisines that are a sum of harmonically related sinusoids. These signals generated in the frequency domain such that the magnitude characteristic is set by the user (i.e., it is customizable), the phases of the cosines are chosen randomly from a uniform distribution
If the multisine contains all/only odd or even harmonics, then it is called full/odd or even multisine. The toolbox also allows users to create other types of multisine with linear and Schroeder phase.
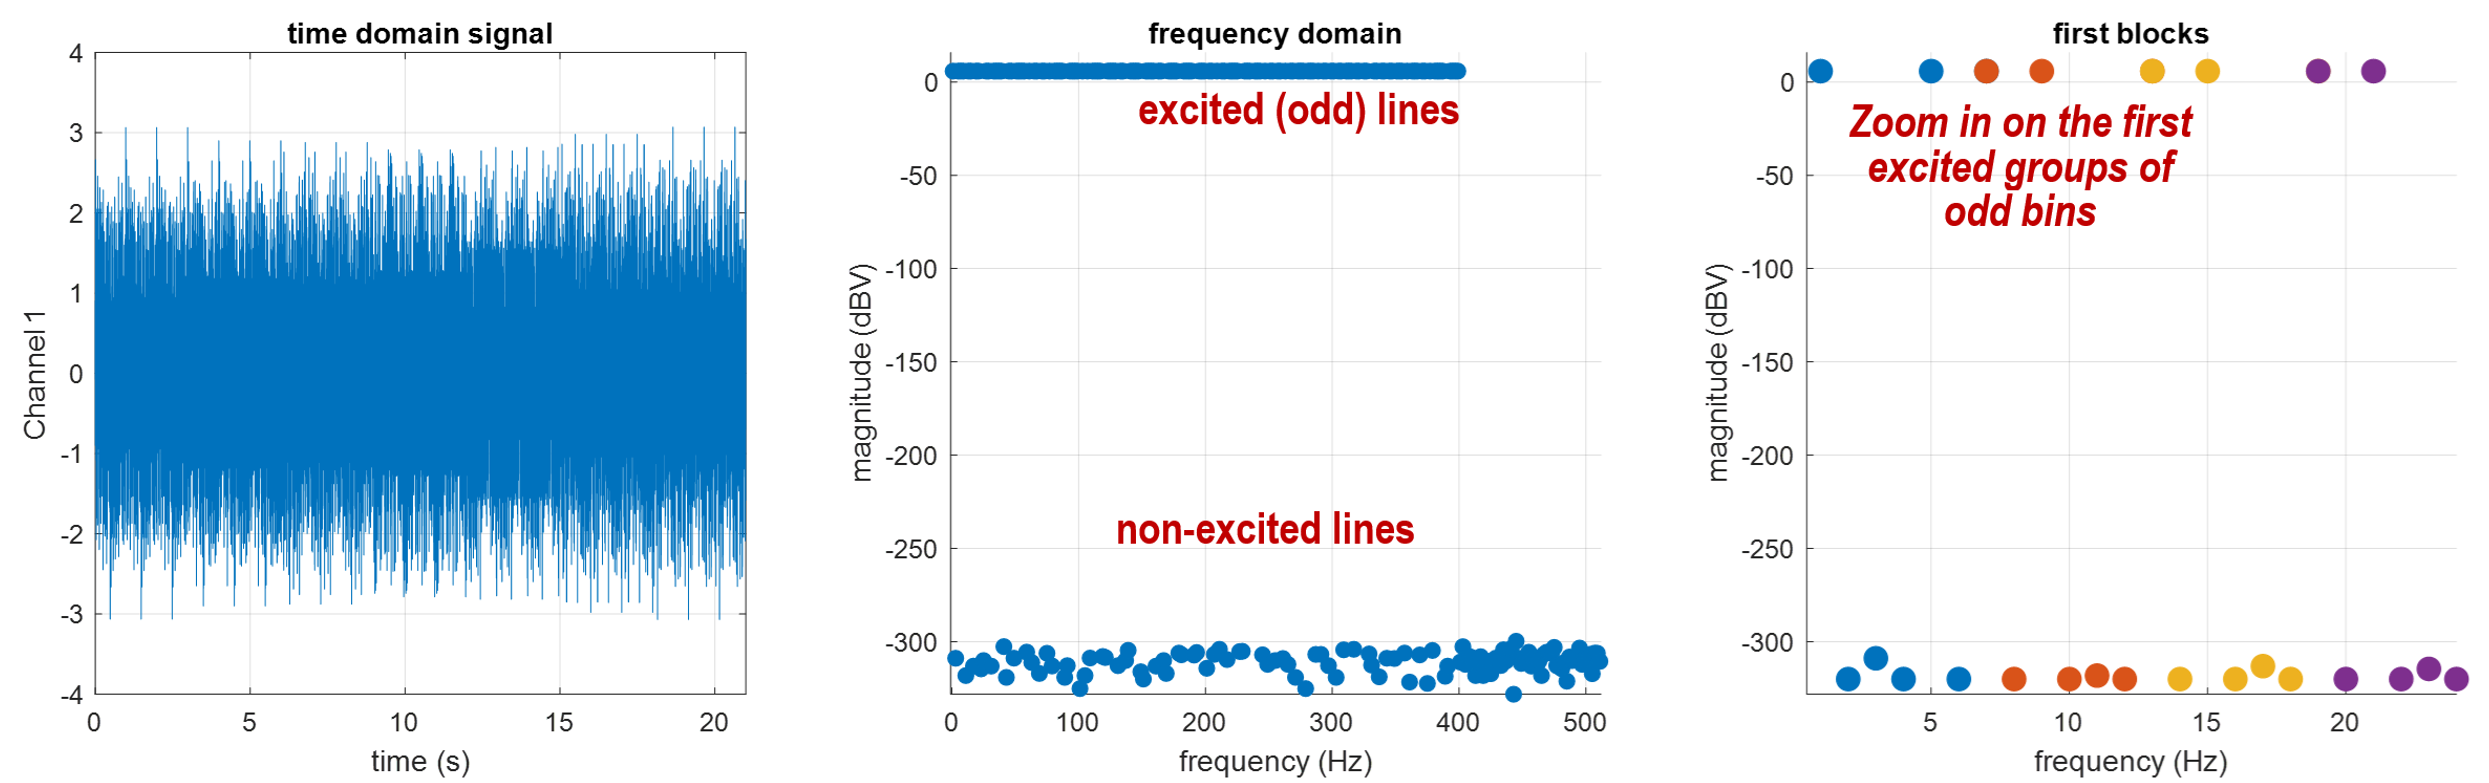
An example of the generated signal using the toolbox.
The Usage
The MUMI toolbox is a user-friendly Matlab based toolbox. It supports command line and graphical user interfaces. The signal generation toolbox has been tested with many simulations, real-life industrial measurements, and it is optimized for MIMO (multiple input, multiple output) experiments.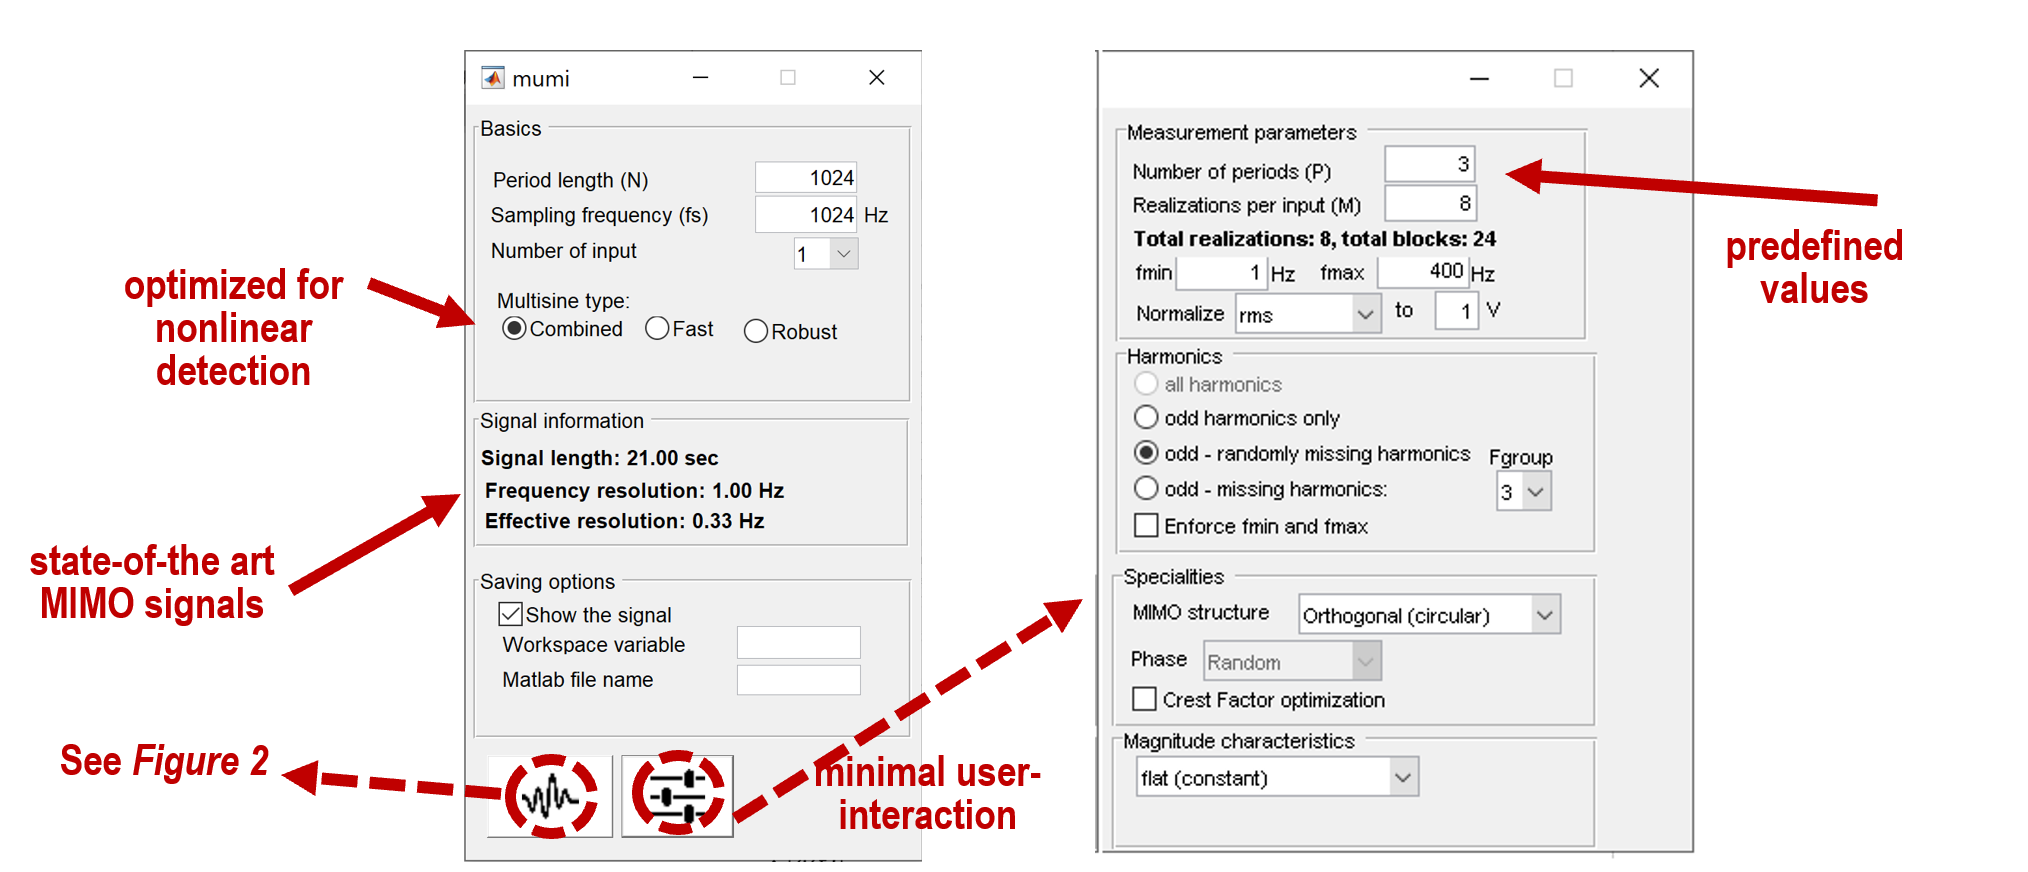
GUI of the multisine generation toolbox. The left figure shows the opening screen where the default values are set from the user-defined profile.
The GUI of the toolbox can be started by calling the ‘mumi.m’ file (or double clicking on the ‘mumi.fig’ file). The starting screen of GUI begins with a simplified view where the most common parameters can be quickly adjusted. By clicking on the ‘advanced settings button’ more interactive setting-sensitive options can be adjusted. If someone wants to explore the command line possibilities, the parametrization and examples can be found by typing ‘help GenerateSignal’. This also implicitly implies that the GUI – which contains many contradiction check-ups – is calling the ‘GenerateSignal.m’ file in the background to create the actual signal.Basically, there are three supported multisines modes in the toolbox (reading the rest of the article will make clear the choices listed here):
1) combined (default, multiple M random realizations and P periods of missing odd multisines),
2) fast (one realization, multiple P periods of missing odd multisines), and
3) robust (multiple M realization of full) multisines.
The toolbox can be used straightway – without setting any parameters – but of course the intended use that the user sets these parameters according to the system under test and the instrumentation setup. The default values can be amended (see the ‘Test_settings.m’ file in the ‘sources folder’) that gives the user the freedom to easily tailor the code according to the actual needs. Such parameters are, for instance,
- The sampling frequency (fs), this is usually determined by the components of the instrumentation and the system under test.
- The number of input channels, determined by the system and/or experiment.
- The maximum power/amplitude level of excitation: determined by the safety margins of the system/instrumentation.
- The frequency resolution (fres) or the number of samples in one period N (the relationship is fs=fres*N).
- The following sections will make sure that the basic choices of the toolbox (e.g. parameter choices and their effect) are adequality described for the novice users.
Multisines for nonlinearity evaluation
In general, when a small excitation level is used, the effects of nonlinearities can be hidden in the noise. If the excitation level is higher, the effect of the nonlinearities become visible. If a full-band multisine excitation is used, then the details of the nonlinear behavior are not directly separable from the linear part. The figure bellow shows an example, how the system response consists of the linear and nonlinear part. When an excitation set of only even harmonics is used, the odd nonlinearities are not detectable. The solution to detect both even and odd nonlinear contributions is to use an excitation set only with odd harmonics, e.g. odd random phase multisine. To examine the odd frequencies, it is needed to skip several odd harmonics in the multisine. The experiences show that the odd, random phase multisine with randomly skipped harmonics is the best what can be used because when a fixed odd harmonic is missing then certain type of nonlinearities can be hidden. A random skipping is recommended to be done within a fixed group of harmonics (Fgroup). The author recommends using a group of three or four, i.e. in each series of three/four odd harmonics, one odd harmonic is skipped randomly. The disadvantage of the missing harmonics multisine is that the effective frequency resolution (that is displayed in GUI) becomes coarser, but on the other hand, at the same power level of the excitation system, the frequency components can be more excited. A further advantage is to mention that using band-limited multisines allows the user to detect in-band and out-band nonlinearities, i.e. to detect that the nonlinearities are limited to the band of excitation or not.It is important to highlight that it is possible to use multiple P periods and M realizations of multisines. Using multiple periods, the SNR (signal-to-noise ratio) will be improved. Using multiple realizations will improve the SNLR (signal-to-nonlinearity ratio).
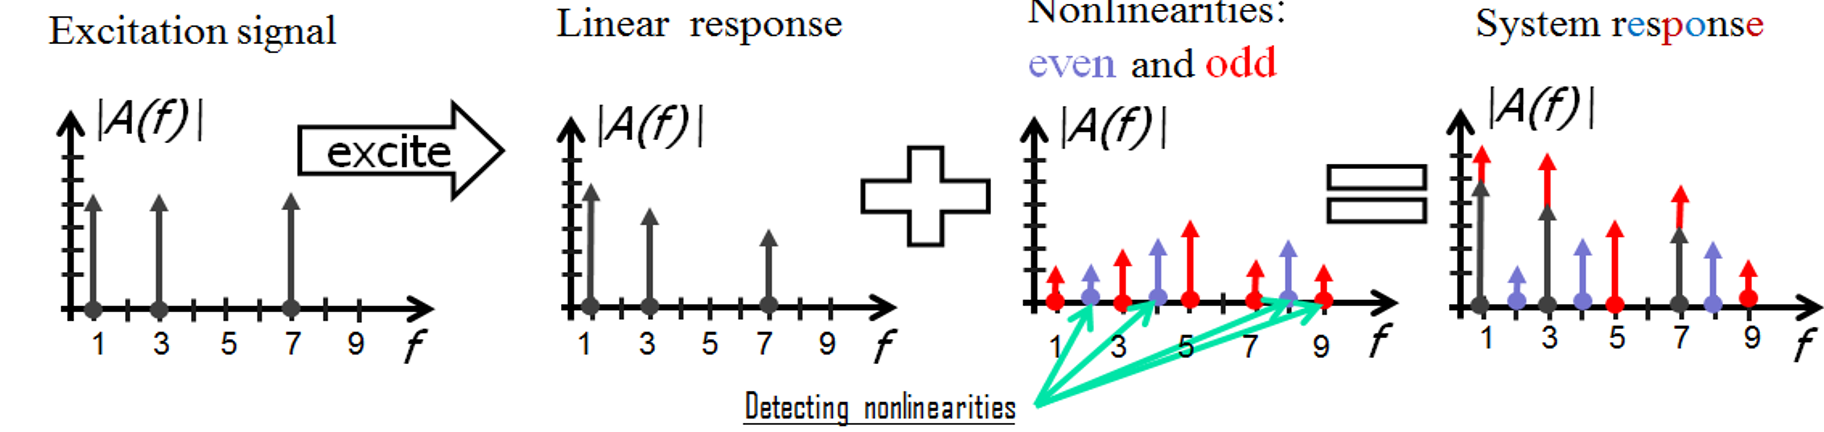
System response originating from linear and nonlinear part of excited system.
Multisines for detection of time-variations
Due to the properties of the spectral output of linear time-varying systems, multisines can be used to detect time-variations. The recommended excitation signal is (the default) odd random phase multisines. A measurement is shown in bellow. Observe that around the excited frequencies skirt-like shapes appear, which could be interpreted as a spectral leakage. Since the usage of multisines will prevent leakage, these skirts are due to time-variations.
The figure on the left shows the magnitude spectrum of the excitation signal. The figure on the right shows the measured output of a time-varying system.
Multisines for multiple input measurements
When considering a MIMO measurement setup, input channel-wise independent experiments are needed. In classical MIMO identification, one of the most often applied solution to this problem is the use of Hadamard decorrelation technique (known as +- technique as well: a square matrix (whose entries are either +1 or −1) is elementwise multiplied with one single realization of the signal. The restriction is that the order of the Hadamard exist for certain dimensions only. Further, it is very important to highlight that a measurement using Hadamard structure unnecessarily “stretches” the structure. For example, think of the vibration testing of a symmetric structure, for instance, an airplane where the wings are excited. The “stretch” appears by applying inputs of opposite sign at certain time instances. In order to overcome the issues with the classical solutions, author recommends using the orthogonal random multisines (default setting), extending the idea of the orthogonal inputs proposed for linear MIMO measurements in. The available options are shown in the GUI under ‘MIMO structure’ options.
Comparison of the classical Hadamard decorrelation technique using noise signal and the proposed orthogonally shifted pseudo-random noise (multisine) signals for a very simple 2x2 MIMO scenario. The number of data samples is kept low to allow visual comparison. Observe that the proposed solution offers more randomness, and the magnitude characteristic is completely flat.
Downloads
The toolbox can be downloaded from Github
See also
References - related articles
1. Csurcsia, P. Z.; Peeters, B.; Schoukens, J. (2020). User-friendly nonlinear framework for industrial measurements with multiple inputs. Mechanical Systems and Signal Processing, Volume 145, November - December 20202. Csurcsia, P. Z.; Peeters, B.; Schoukens, J.; De Troyer, T. (2020). Simplified Analysis for Multiple Input Systems: A Toolbox Study Illustrated on F-16 Measurements. Vibration. 3(2), 70-84
3. Csurcsia, P. Z. (2013). Static Nonlinearity Handling Using Best Linear Approximation: An Introduction. Pollack Periodica, 4(1), 1-12.
4. Csurcsia, P. Z. (2015). Part 1: Nemlinearitások detektálása multiszinuszos gerjesztéssel. Elektronet. 24(5), 36-40. (in Hungarian)
5. Csurcsia, P. Z. (2015). Part 2: Nemlinearitások detektálása multiszinuszos gerjesztéssel. Elektronet. 24(6), 44-47. (in Hungarian)
6. Ramaswamy, K. R.; Csurcsia P. Z.; Van den Hof P.; Schoukens J. A frequency domain approach for local module identification in dynamic networks. Automatica
7. Siddiqui, M. F.; De Troyer, T.; Csurcsia, P. Z.; Decuyper, J.; Schoukens, J.; Runacres, M.; A nonlinear state-space model of the unsteady lift force on a pitching wing. Mechanical Systems and Signal Processing
8. Csurcsia, P.Z.; Decuyper J.; Schoukens J.; De Troyer T. A study on decoupling PNLSS models illustrated on an F16 air fighter. Mechanical Systems and Signal Processing
9. Csurcsia, P. Z.; Peeters, B.; P., De Troyer, T. Simplified nonlinearity assessment of MIMO systems illustrated on ground vibration testing. Mechanical Systems and Signal Processing
10. Csurcsia, P. Z.; Peeters, B. Time-varying Operational Modal Analysis using Multidimensional Regularization.
11. Csurcsia, P.Z.; De Troyer T. (2021). An empirical study on decoupling PNLSS models illustrated on an airplane. 19th IFAC Symposium on System Identification. Italy.
12. Csurcsia, P.Z.; Decuyper J.; Schoukens J.; De Troyer T. (2021). Empirical study on decoupling PNLSS models illustrated on F16. Workshop on Nonlinear System Identification Benchmarks. Eindhoven, The Netherlands
13. Van den Bossche, S.; Csurcsia, P.Z. (2021). Modelling of F-16 Ground Vibration Testing Measurements Using Machine Learning Techniques. International Modal Analysis Conference. Orlando, USA
14. Csurcsia, P.Z.; De Troyer T. (2021). Frequency Response Function Estimation for Systems with Multiple Inputs using Short Measurement: A Benchmark Study. International Modal Analysis Conference. Orlando, USA
15. Csurcsia, P.Z.; Decuyper J.; De Troyer T. (2021). Nonparametric Nonlinear Modelling of an F16 Ground Vibration Testing Measurement. International Modal Analysis Conference. Orlando, USA
16. Csurcsia, P. Z.; Peeters, B.; Schoukens, J. (2020). B-spline based time-varying operational modal analysis illustrated on a wind tunnel testing measurement. International Conference on Noise and Vibration Engineering. Leuven. Belgium
17. Csurcsia, P. Z.; Peeters, B.; Schoukens, J. (2020). The Best Linear Approximation of MIMO systems: simplified nonlinearity assessment using a toolbox. International Conference on Noise and Vibration Engineering. Leuven. Belgium
18. Peeters, B.; Csurcsia, P. Z.; Bianciardi, F (2020). Novel MIMO Frequency Response Function estimation technique suited for short measurements: a benchmark study. International Conference on Noise and Vibration Engineering. Leuven. Belgium
19. De Troyer, T.; Csurcsia, P. Z.; Greenblatt D (2020). Nonlinear system identification of a pitching wing in a surging flow. International Conference on Noise and Vibration Engineering. Leuven. Belgium
20. Elkafafy, M.; Csurcsia, P. Z.; Cornelis, B.; Risaliti, E; Janssens, K (2020). Machine learning and system identification for the estimation of data-driven models: An experimental case study illustrated on a tire-suspension system. International Conference on Noise and Vibration Engineering. Leuven. Belgium
21. Siddiqui, M. F., Csurcsia, P. Z.; De Troyer, T.; Runacres M. C. (2020). Development of a nonlinear data-driven model of the lift on a pitching aerofoil. Torque 2020. Delft, the Netherlands
22. Csurcsia, P. Z.; Di Lorenzo, E.; Musella, U.; Hallez, R.; Debille, J.; Peeters, B. (2019). Structural dynamics assessment on a full-electric aircraft: ground vibration testing and in-flight measurements. International Forum on Aeroelasticity and Structural Dynamics. Georgia, USA
23. Csurcsia, P. Z.; Peeters, B.; Schoukens, J. (2019). The Best Linear Approximation of MIMO Systems: First Results on Simplified Nonlinearity Assessment. International Modal Analysis Conference. Orlando, USA
24. Csurcsia, P. Z.; Peeters, B.; Schoukens, J. (2019). Tracking the modal parameters of time-varying structures by regularized nonparametric estimation and operational modal analysis. 2019 International Operational Modal Analysis Conference. Coppenhagen, Denmark
25. Csurcsia, P. Z.; Schoukens, J.; Peeters, B. (2018). Regularized time-varying operational modal analysis illustrated on a wind tunnel testing measurement. International Conference on Noise and Vibration Engineering. Leuven, Belgium
26. Luczak, M.; Peeters, B.; Manzato, S.; Di Lorenzo, E.; Csurcsia, P. Z.; Reck-Nielsen, K.; Ruffini, V. (2018). Integrated dynamic testing and analysis approach for model validation of an innovative wind turbine blade design. International Conference on Noise and Vibration Engineering. Leuven. Belgium
27. Alvarez Blanco, M.; Csurcsia, P. Z. ; Carrera, A. ; Peeters, B. (2018). Nonlinearity Assessment of MIMO Electroacoustic Systems for Direct Field Environmental Acoustic Testing. 31st Aerospace Testing Seminar. Los Angeles, USA
28. Alvarez Blanco, M.; Csurcsia, P. Z.; Peeters, B.; Janssens, K.; Desmet, W. (2018). Nonlinearity assessment of mimo electroacoustic systems on direct field environmental acoustic testing. International conference on Noise and Vibration Engineering. Leuven, Belgium.
29. Csurcsia, P. Z.; Schoukens, J.; Peeters, B. (2018). Nonparametric Approximation of the Nonlinear SilverBox Data: a Linear Time-varying Approach. Workshop on Nonlinear System Identification Benchmarks. Liege, Belgium
30. Csurcsia, P. Z.; Ramaswamy, K. R.; Van den Hof P.; Schoukens J (2021). A frequency domain approach for local module identification in dynamic networks. Workshop of the European Research Network on System Identification. The Netherlands
31. Csurcsia, P. Z., Peeters, B. (2020). User-friendly Nonparametric Framework for Vibro-acoustic Industrial Measurements with Multiple Inputs. Benelux Meeting on Systems and Control. The Netherlands
32. Peeters, B., Csurcsia, P. Z. (2019). Structural nonlinearities - an industrial view. Workshop on Nonlinear System Identification Benchmarks. Eindhoven. The Netherlands
33. Csurcsia, P. Z., Peeters, B., Schoukens, J. (2019). An industrial nonparametric framework for measurements of nonlinear systems. ERNSI Workshop on System Identification. The Netherlands
34. Peeters, B., Csurcsia, P. Z. (2018). The use of exotic multisines in MIMO structural dynamics and acoustic applications. Workshop on Nonlinear System Identification Benchmarks. Liege, Belgium